Trends in Biodiversity-Related Disclosures and Metrics
In recent years, corporate disclosure of ESG information—often referred to as non-financial information—and accountability have become increasingly important. While climate-related disclosure remains the core topic today, guideline development for biodiversity-related disclosure has also progressed. This article focuses on biodiversity and highlights global and domestic trends as well as corporate actions.
Table of Contents
Growing Interest in Biodiversity
Global attention to GHG (Greenhouse Gases) emissions, including CO₂, has increased. However, climate change brings multiple impacts from various perspectives, and in this article we focus specifically on biodiversity—one of the areas affected by global warming. For example, climate change can disrupt ecosystems by reducing suitable habitats, which leads to declines in species populations.
If biological resources diminish, humans—who depend heavily on organisms for food and fuel—will struggle to maintain current living conditions. In effect, the materials essential for future survival would be lost. Protecting biodiversity has therefore become indispensable for a sustainable future. This article outlines recent global developments in biodiversity conservation and the expected corporate responses.
Biodiversity is generally classified into three elements.
The first is species diversity, which includes not only animals and plants familiar to us but also microorganisms. According to estimates, 5 to 30 million species exist on Earth. They complement each other to form an ecosystem, influencing food chains and population fluctuations mutually.
The second is genetic diversity. As with humans, individual plants and animals within the same species have different genetic characteristics. Such diversity helps prevent extinction due to diseases or climate changes, strengthening adaptability to the natural environment.
The third is ecosystem diversity, which refers to the existence of various natural environments such as forests, rural landscapes, rivers, and oceans. Ecosystem diversity supports species diversity. Living organisms, including humans, receive food, water, and timber from ecosystems such as forests and freshwater environments. These benefits are known as ecosystem services.
The reason biodiversity matters is that it enables stable food chains, which underpin basic human life. For example, if insects in a region decline or disappear, animals depending on them lose their food source. As a result, those animals may decrease or migrate to other regions. This migration disrupts the receiving ecosystem, and if certain plants decline, insects and animals relying on them are also affected. In some cases, these changes can even influence the local climate (*1).
Current Status of Biodiversity-Related Disclosure
In Japan, guidelines for biodiversity-related corporate disclosure are advancing, such as the TNFD beta version and the Ministry of the Environment’s Biodiversity Private Sector Engagement Guidelines (*2).
Although methods for target setting and quantitative indicators are still under discussion, companies are gradually expanding disclosure based on their materiality and internal targets. This trend is visible both domestically and internationally.
Domestic Trends Following Global Guideline Development
Over the past decade, biodiversity has gained traction as a topic for global guideline development. Reflecting this, Japan has also seen increasing activity among government agencies, financial institutions, and investors.
Globally, the Aichi Targets were adopted in 2010, followed by a mid-term review in 2014. Biodiversity mainstreaming in agriculture, forestry, fisheries, and tourism progressed in 2016. In 2020, new agreements were made in Montreal, including conserving at least 30% of land and oceans by 2030 and strengthening biodiversity impact assessment and disclosure for businesses.
In line with these developments, Japan formulated the “National Biodiversity Strategy (2023–2030)” in December 2022, reflecting the Kunming-Montreal Global Biodiversity Framework. The strategy sets an action goal to promote quantitative assessment of corporate dependencies and impacts on biodiversity to strengthen analysis of current conditions, and to support science-based target setting and disclosure, all as part of Japan’s transition toward a nature-positive economy (*3). As a result, the movement to require corporate disclosure in Japan is expected to become even stronger.
Example Guidelines: TNFD and LEAP
TNFD (Taskforce on Nature-related Financial Disclosures) is a biodiversity-focused framework modeled on TCFD (*4). It was established based on the recognition that economic activities are highly dependent on natural capital and aims to visualize the risks associated with this dependency so that financial institutions and investors can make appropriate decisions.
TNFD proposes four categories—governance, strategy, risk and impact management, and metrics and targets—consisting of 14 recommended disclosure items (*5). Companies are expected to disclose environmental impacts across the entire value chain.
TNFD also promotes the LEAP approach, which stands for Locate, Evaluate, Assess, and Prepare. After scoping, companies follow this process for disclosure:
- Locate: Identify points of interaction with nature
- Evaluate: Diagnose dependencies and impacts
- Assess: Assess nature-related risks and opportunities
- Prepare: Determine responses to identified risks and opportunities and prepare for disclosure
Biodiversity Assessment Methods
Based on global trends, Japan has introduced tools for biodiversity assessment. Below are five methods aligned with the LEAP approach, presented in the Ministry of the Environment’s guideline as key tools for assessing biodiversity. (*6)(*7).
Examples of cross-cutting biodiversity impact assessments methods include the Ecological Footprint indicator (*8), LIME2/LIME3 (*9), and ENCORE(Exporing Natural Capital Opportunities, Risks and Exposure) (*10).
One useful tool for the Locate step (identifying points of interaction with nature) in the LEAP approach is the Ecological Footprint indicator.
The Ecological Footprint indicator helps identify potential sourcing regions by inputting volume and weight of procured items. It also provides land-use-based results from environmentally extended input-output analysis at the national level. However, it requires additional research due to limited publicly available methodologies, involves licensing costs, and excludes calculations of freshwater extraction and non-renewable resources such as fossil fuels (*11).
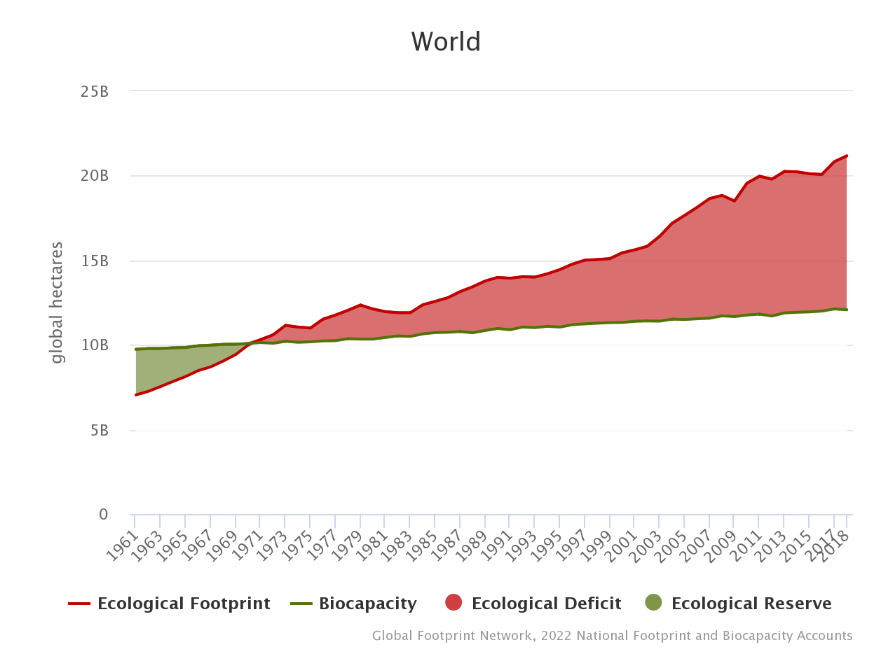
Figure from website of Ecofoot Japan https://ecofoot.jp/ef-database/
ENCORE (*10) and IBAT (*12) are useful during the Evaluate phase.
ENCORE helps users visualize how environmental changes may affect economic activities and identify potential nature-related risks. Although it is mainly used by financial institutions to evaluate the risks and opportunities that investee companies pose to natural capital, companies can also use it to assess their own operational sites and raw material sourcing regions. Although ENCORE is mainly used by financial institutions to evaluate the risks and opportunities that investee companies pose to natural capital, companies can also use it to assess their own operational sites or locations where suppliers source raw materials. While it helps understand overall dependencies and impacts, it cannot analyze impacts at the individual commodity or business-specific level.
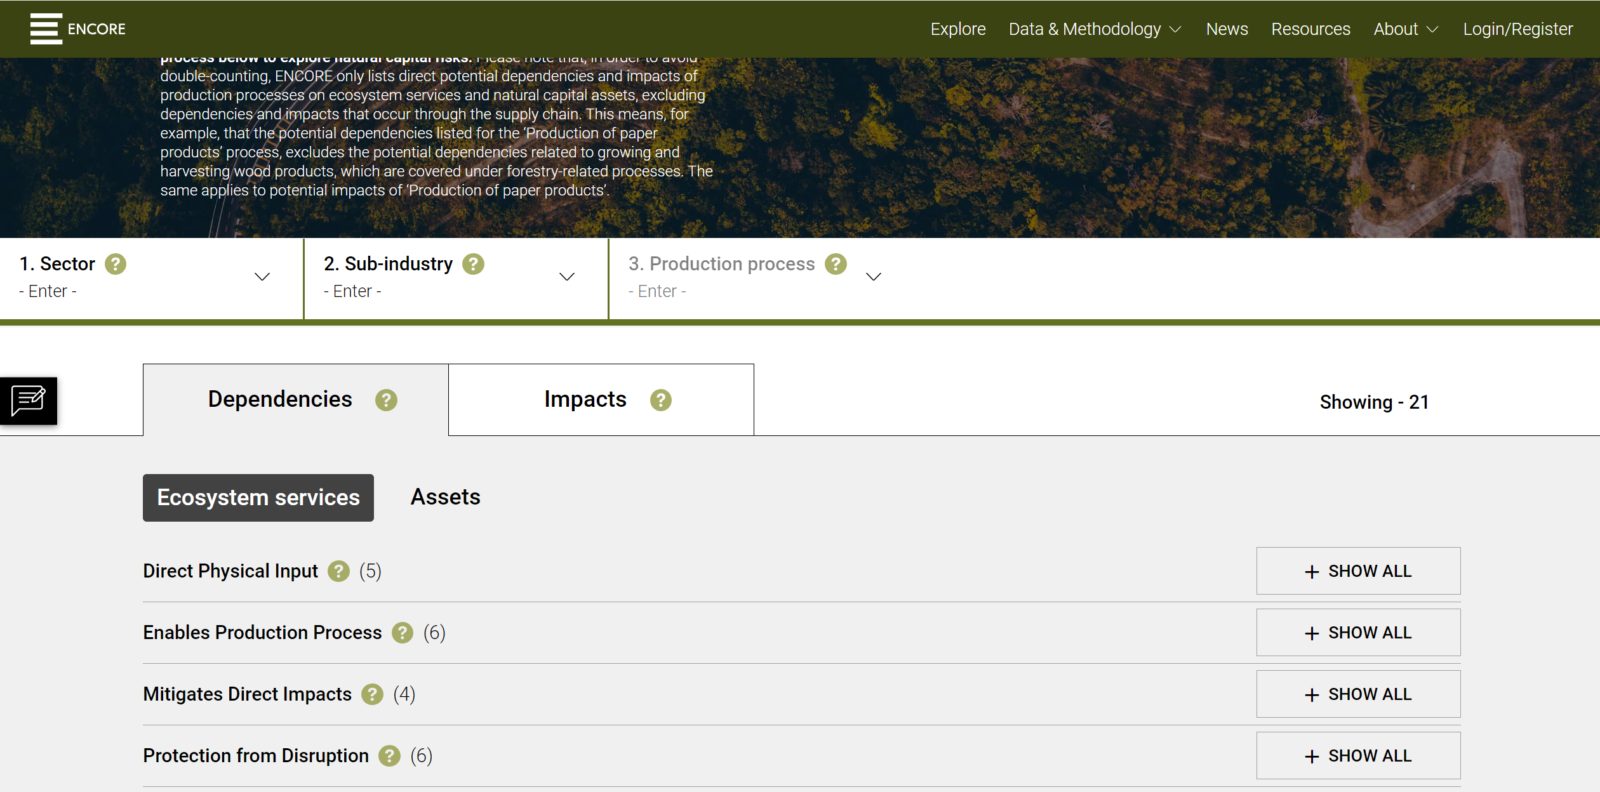
Figure from ENCORE website: https://www.encorenature.org/en/explore
IBAT aggregates map-based biodiversity data, such as protected areas and endangered species. If a country registers protected areas in the WDPA (*13), users can identify KBAs (*14) and other key conservation areas. IBAT allows initial screening of potential impacts from land-use changes, but it cannot capture prefecture-level distributions of important species or biodiversity hotspots.
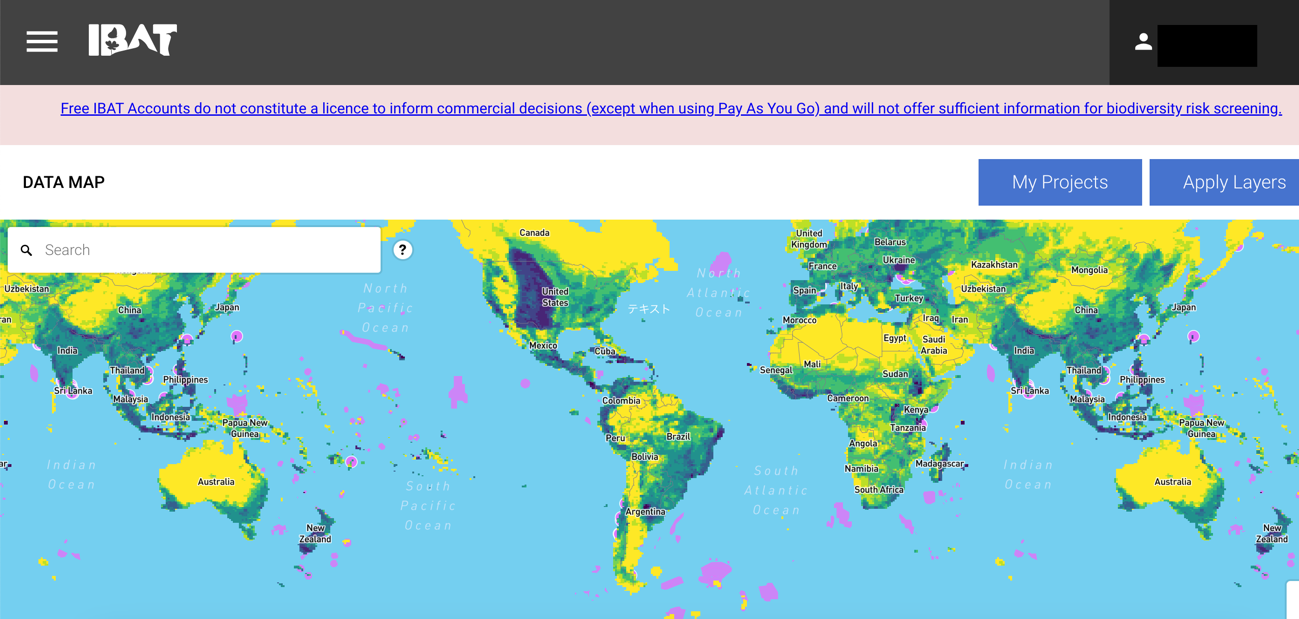
Figure from IBAT website: https://www.ibat-alliance.org/
While these global tools support broad assessments, local-level data remain insufficient, even though such information is essential for planning nature-related actions at the regional scale—and this data gap is increasingly recognized as an issue.
In the Assess phase, Trase (*15) and LIME2/LIME3 (*9) are effective.
Trase is a tool for assessing impacts on water, forests, and other natural ecosystems. It visualizes supply chains linking consumer countries and trade actors to production regions for forest-risk commodities. It helps identify countries, regions, and traders associated with high deforestation risks. Its limitation is that it currently covers only 13 high-deforestation commodities (e.g., soy, palm oil, beef, shrimp, cocoa, coffee, maize, wood pulp, palm kernel, chicken, cotton, sugarcane, pork).
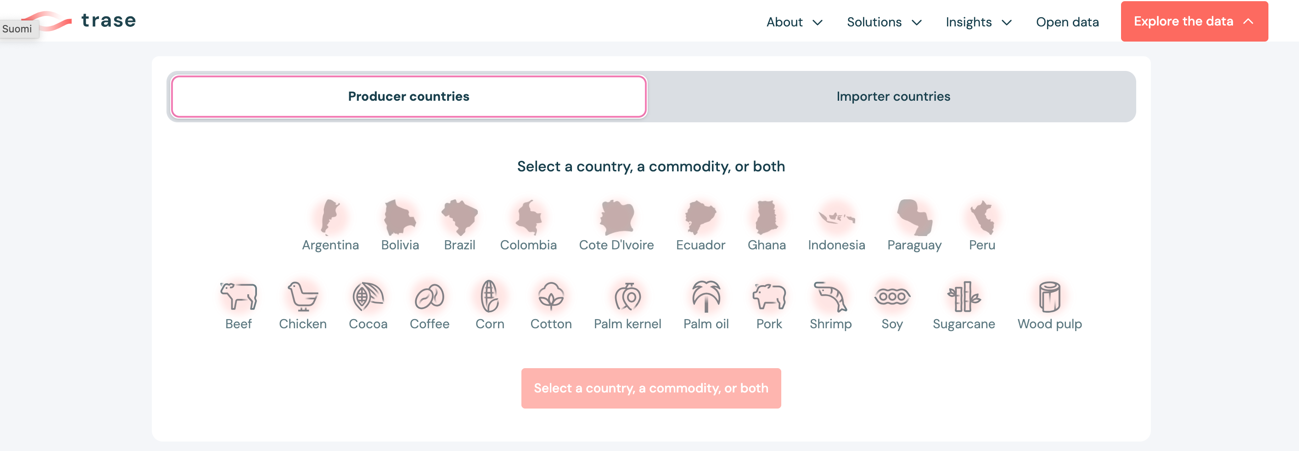
Figure from Trase website: https://trase.earth
LIME2/LIME3 requires a paid license, as with the Ecological Footprint indicator, due to their pre-developed and standardized databases. As LCIA methods, they enable cross-sectoral assessment across biodiversity, primary production, climate change, air pollution, and more. LIME3 expands LIME2 by incorporating global datasets for climate change, transboundary air pollution and PM2.5, water consumption, underground resource consumption, and forest and mineral resource use (*16). It quantitatively evaluates the environmental impacts arising from the use of material resources in human and business supply chains, including both direct and indirect effects on ecosystems, and enables this to be evaluated from a resource-consumption perspective.
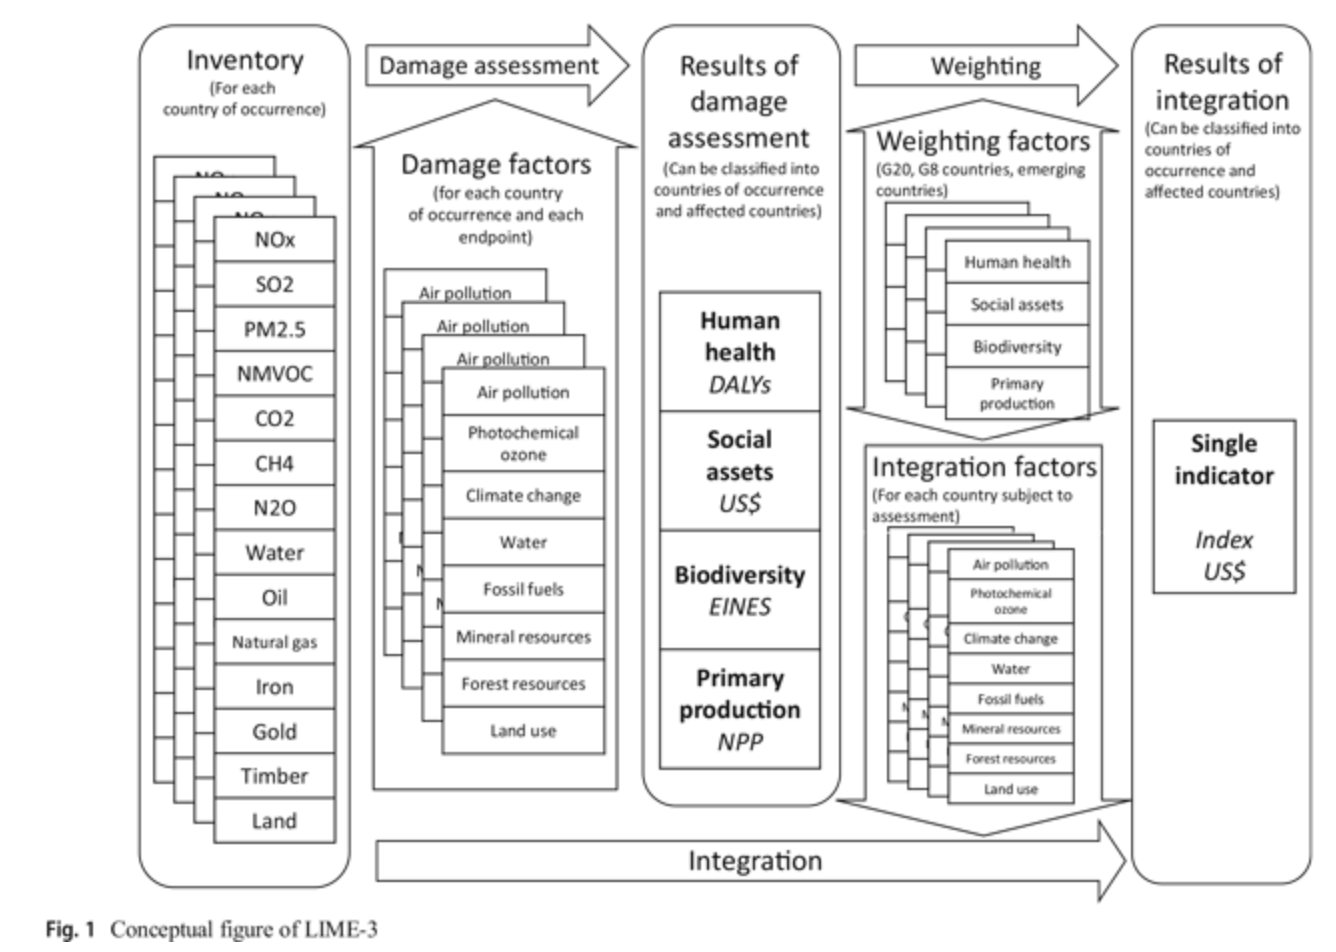
Figure from LCA Society of Japan website : https://lca-forum.org/english/lime/
Corporate Case Studies Using Biodiversity Assessment Tools
Several Japanese companies have begun measuring environmental impacts of their products using these tools. Here are several examples of companies that have disclosed this information.
Kao (*17), has developed its own biodiversity assessment criteria due to the lack of a unified certification system. It assesses all production sites and uses LIME2 for environmental impact analysis. Ecological Footprint assessments are utilized as a performance indicator for Kao’s environmental initiatives. (*18).
Shiseido (*19) conducted a comparative assessment of the “environmental impact and positive effects of their hand soap” using LIME3. The study quantitatively compared the environmental impacts of promoting handwashing habits in developing countries with the benefits of reducing diarrhea-related impacts. It revealed that even identical products show different environmental impacts depending on the country or region of raw material procurement, production, distribution, use, and disposal (*20).
Kirin Holdings (*21) applied the LEAP approach to assess a tea plantation in Sri Lanka, where regional dependency is relatively high. In the Locate phase, the company selected ten plantations near national parks and used the IUCN Global Ecosystem Typology (*22), which is a comprehensive framework for classifying ecosystems, along with other relevant sources, to understand surrounding ecosystems.
Since ENCORE contains similar elements, it can also serve as a substitute. Kirin used IBAT and Aqueduct Water Risk Atlas (*23) to identify priority areas and evaluate anthropogenic pressures, conservation importance, and water stress. In the evaluate phase, Kirin reviewed local academic studies to identify relevant natural assets and ecosystem services. The assessment phase is still underway, but results from LEAP are already informing improvements in water use and fertilizer management, preparing the company for the Prepare phase (*24).
Future Trends in Biodiversity Disclosure
Companies across regions have begun taking steps toward biodiversity-related disclosure, influenced in part by the development of standards and frameworks in the EU, which aligns with the extended agenda of the Conference of the Parties (COP) to the United Nations Framework Convention on Climate Change (*6).
Under the Corporate Sustainability Reporting Directive (CSRD) (*25), which took effect on January 5, 2023, EU member states must adopt national legislation by July 6, 2024 (*26).
This has implications for Japanese companies. If a Japanese company has a large subsidiary in the EU that does not fall under the NFRD (*27), reporting obligations will begin for financial years starting January 1, 2025, with disclosure required in 2026. For listed SMEs, obligations start in 2026 with reporting in 2027. Non-EU multinationals with significant turnover in the EU may also face requirements beginning January 1, 2028, with reporting in 2029 (*28).
As international demands for disclosure of information on biodiversity increase, Japan’s response is also drawing attention. Instead of implementing measures to neutralize the negative impact after being mandated, proactive disclosure enables companies to gain positive evaluations as leaders in the market.
Enhancing Product Value and Corporate Value
Corporate disclosure of biodiversity and broader ESG indicators is evolving rapidly. Staying aligned with these changes—and integrating them proactively—offers major advantages. However, the analyses involved are technically complex and often exceed internal resource capacity.
Our company specializes in food and agriculture and streamlines quantitative assessment models for diverse environmental indicators. We evaluate and communicate eco-scores for various foods, including primary products (agricultural and marine), processed foods, and foodservice menus. We also provide systems and services that support these analyses. If you are interested in using food-related eco-indicators beyond decarbonization to enhance the appeal of your products, please feel free to contact us.
”cuoncrop” ESG Global Trend Research Division
References
*1 https://ideasforgood.jp/matome/biodiversity/
*2 https://www.env.go.jp/press/press_01452.html
*4 https://www.env.go.jp/policy/tcfd.html
*7 https://www.env.go.jp/content/000125803.pdf
*8 https://www.env.go.jp/content/000178848.pdf
*9 https://lca-forum.org/english/lime/
*10 https://www.env.go.jp/content/000174922.pdf
*11 https://ecofoot.jp/what-is-ef/
*12 https://www.env.go.jp/content/000168520.pdf
*13 https://www.protectedplanet.net/en/thematic-areas
*14 http://kba.conservation.or.jp/about.html
*16 https://lca-forum.org/research/workingmember.html
*18 https://www.kao.com/jp/sustainability/planet/
*19 https://www.shiseido.co.jp/
*20 https://lca-forum.org/research/pdf/LIME3_results_report.pdf
*21 https://www.kirinholdings.com/jp/
*22 https://www.iucn.org/resources/conservation-tool/iucn-global-ecosystem-typology
*24 https://www.kirinholdings.com/jp/investors/files/pdf/environmental2023_03.pdf
*24https://www.nikkei.com/article/DGXKZO70591790R00C21A4X12000/
*25 https://www.wpk.de/english/public/new/csrd-entered-into-force-on-5-january-2023/
*28 https://www.csrdpro.com/en/csrd-deadlines-by-country-2025-2028/