The Importance of the Agri-Food Industry in Achieving Carbon Neutrality
In this article, drawing on the Sixth Assessment Report of the Intergovernmental Panel on Climate Change (IPCC), we organize the relationship between global warming and the food and agriculture sector. Based on these findings, we reaffirm the necessity for both consumers and companies to take concrete action to address global warming.
Table of Contents
- 1 What Is the Intergovernmental Panel on Climate Change (IPCC)?
- 2 What Is the Sixth Assessment Report?
- 3 The Importance of GHG Emissions Reduction in the Food System
- 4 Environmental Impact Assessment of Food and the Digital Product Passport (DPP)
- 5 Accelerating Corporate ESG Activities Through the Visualization of Food Sustainability
What Is the Intergovernmental Panel on Climate Change (IPCC)?
IPCC is an acronym for the Intergovernmental Panel on Climate Change. It is an intergovernmental body established in 1988 by the World Meteorological Organization (WMO) and the United Nations Environment Programme (UNEP). As of 2022, it comprises 195 member countries and regions (*1).
The Role of the IPCC
We first outline the role of the IPCC. Researchers nominated by the governments of member countries assess the latest scientific findings and, every few years, publish three core reports—covering (1) the physical science basis, including the current state of global warming and future projections, (2) impacts on regions and ecosystems, and (3) mitigation—as well as an integrated Synthesis Report (*2).
IPCC reports are widely used by policymakers when formulating and deciding climate policies. At the same time, the IPCC maintains strict scientific neutrality and does not advocate for specific policy measures (*3).
The Credibility of the IPCC
Why, then, do policymakers around the world place such a high level of trust in the IPCC?
Masahide Emori of the National Institute for Environmental Studies, one of the contributing authors, has emphasized the IPCC’s thorough comprehensiveness, rigor, and transparency. His comments illustrate why the IPCC stands out as a highly credible source:
“IPCC reports are written by more than 200 experts from 66 countries and cite over 14,000 scientific papers. Each report undergoes three rounds of peer review. In this process, draft manuscripts are reviewed by a wide range of experts who provide feedback. In the most recent cycle, a total of 78,000 comments were addressed. All comments and the IPCC’s responses are publicly disclosed” (*4).
What Is the Sixth Assessment Report?
The IPCC publishes two types of reports: periodic assessment reports and theme-specific special reports. The periodic assessment reports began with the First Assessment Report (FAR) released in 1990. The most recent report, the Sixth Assessment Report (AR6), was published on February 28, 2022.
This article discusses the validity of global warming and its relationship with food and agriculture, focusing primarily on the findings of this latest report. 。
Ⅰ. It is Unequivocal that Humans Are Causing Global Warming.
A: Rising Temperatures
One of the most widely noted conclusions of the Sixth Assessment Report (AR6) is the relationship between global warming and human activity.
“Human influence” refers to the warming effect caused by increased concentrations of greenhouse gases (GHGs), such as carbon dioxide, in the atmosphere (*5).
Specifically, global warming is attributed to radiative forcing caused by anthropogenic GHG emissions. Radiative forcing represents changes in the Earth–atmosphere energy balance resulting from variations in GHG concentrations or solar radiation. Positive radiative forcing leads to surface warming, while negative radiative forcing has a cooling effect (*6).
For many years, scientists debated whether the factors influencing radiative forcing could truly be attributed to human activity. In AR6, the IPCC concluded with near certainty that the cause is human activity, using the unprecedentedly strong wording “unequivocal” (*7).
In previous reports, the likelihood that human activity was the primary cause of global warming was assessed as “likely” (66% or higher) in the Third Assessment Report, “very likely” (90% or higher) in the Fourth, and “extremely likely”(95% or higher) in the Fifth Assessment Report published in 2014.
In contrast, the Sixth Assessment Report states:
“It is unequivocal that human influence has warmed the atmosphere, ocean and land.”
This marked the first time the IPCC definitively concluded that human activity is the cause of global warming (*8).
The basis for this conclusion includes the observation of rapid changes in global average temperature that cannot be explained without human influence. The sharp temperature increase observed since the Industrial Revolution has no precedent in the past 2,000 years and exceeds temperatures during the warmest periods of the last 100,000 years (*7) (see Figure 1(a)).
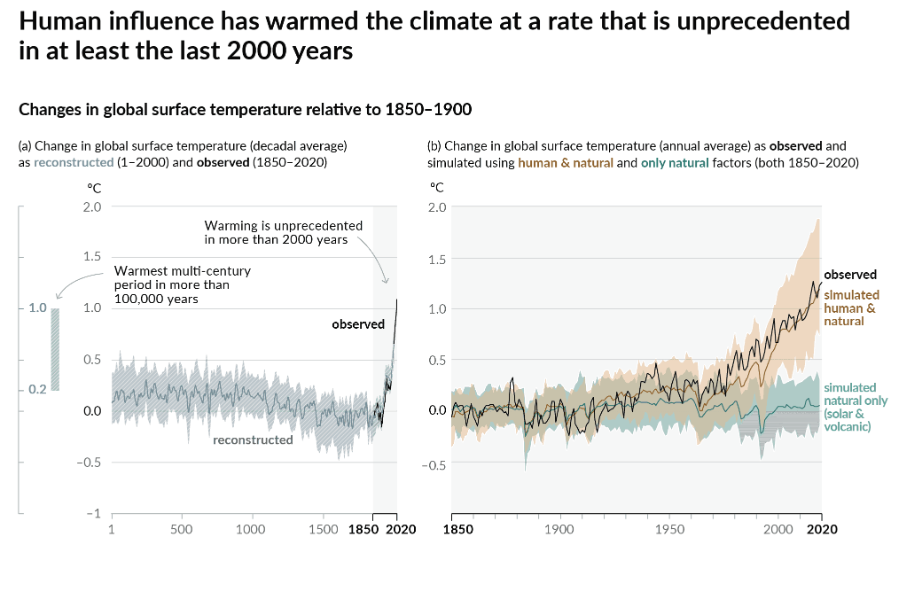
Figure1 <Reference>IPCC Sixth Assessment Report Working Group 1 Summary for Policymakers P6 ,Figure SPM1(*7)
Simulations using climate models from the Coupled Model Intercomparison Project Phase 6 (CMIP6) show that when only natural factors such as volcanic activity and solar variability are considered, no rapid temperature rise occurs. When both natural factors and human activity are included, the models reproduce a sharp temperature increase that closely matches observed data. This demonstrates that the observed warming cannot be explained without human influence (see Figure 1(b)).
B: Increase in Extreme Events
In recent years, extreme events such as heavy rainfall, heat waves, droughts, and unusually strong out-of-season typhoons have increased. The Sixth Assessment Report concludes that these extreme events are also attributable to human activity.
Rising average temperatures driven by human activity increase atmospheric water vapor, which in turn raises the frequency and intensity of heavy precipitation and affects weather patterns in multiple ways (*7).
Ⅱ. Climate Impacts Are Projected Using Five Scenarios
When considering climate change, it is essential to collect information from a long-term perspective and anticipate how business environments may change as a result.
However, outcomes can vary significantly due to uncertainties, including the pace and nature of societal change. For this reason, climate projections are typically developed using multiple scenarios and comparing outcomes across them.
In Working Group I (WGI) of the Sixth Assessment Report, the IPCC defines five future scenarios by combining Shared Socio-economic Pathways (SSPs) with radiative forcing levels projected for 2100, which roughly correspond to atmospheric CO₂ concentrations (see Figure 2).
The Shared Socio-economic Pathways model how socioeconomic factors, such as population growth, economic development, education, urbanization, and technological progress, may evolve over the next century. These pathways explore five distinct development trajectories in the absence of additional climate policy and illustrate how different levels of mitigation can be achieved when SSPs are combined with Representative Concentration Pathways (RCPs) (*9).
Based on these assumptions, future temperature increases are projected using radiative forcing as a measure of changes in the Earth–atmosphere energy balance driven by GHG concentrations and solar radiation (*10).
Note: The feasibility of achieving each scenario is not assessed.
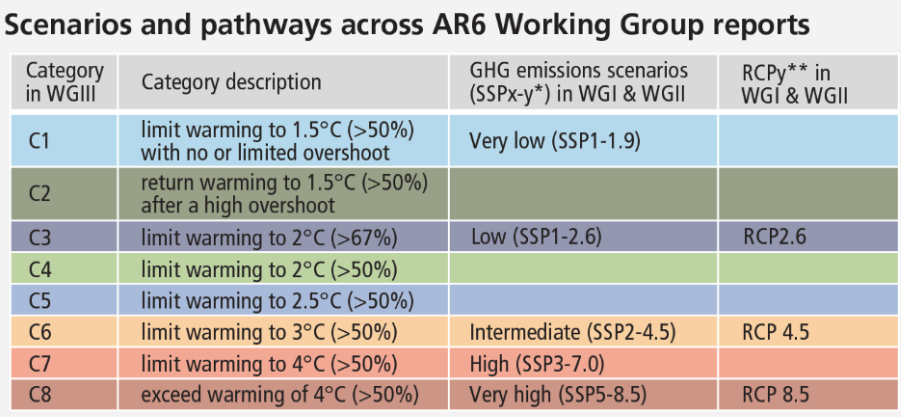
Figure2 <Reference> IPCC Sixth Assessment Report Working Group 1 Summary for Policymakers Cross-Section Box.2, Figure 1 (*11)
Under the SSP5-8.5 scenario, which assumes minimal government intervention to curb GHG emissions, global average temperatures in 2081–2100 are projected to rise by approximately 4.4°C compared with 1850–1900 levels. Global mean sea level rise by 2100 is projected to reach 0.63–1.01 meters relative to 1995–2014 (*7).
In contrast, under the SSP1-1.9 scenario, which assumes early and aggressive policies to limit warming to below 1.5°C by the end of the 21st century, average temperature increase is projected at around 1.6°C, with sea level rise limited to 0.28–0.55 meters. Even in this scenario, there is roughly a 50% probability that average temperatures will temporarily reach 1.5°C during the period from 2021 to 2040 (*7).
Under the “intermediate” scenario reflecting current policy levels, global average temperatures are projected to exceed 2°C by mid-century (*7). These projections demonstrate that early climate action can significantly mitigate future temperature increases and sea level rise.
III. The Need for Carbon Neutrality
The Paris Agreement, adopted in December 2015, set a goal of limiting the increase in global average temperature to well below 2°C, while pursuing efforts to limit the increase to 1.5°C (*12).
At first glance, a difference of 0.5°C may appear minor. However, even this incremental increase can have substantial impacts on ecosystems and significantly increase the frequency and severity of natural disasters. Climate science indicates that once certain thresholds are crossed, the climate system may undergo large-scale and irreversible changes. One such tipping point is a 1.5°C increase relative to pre-industrial levels (*13).
Achieving the 1.5°C target requires both carbon neutrality and adherence to a carbon budget.
Carbon neutrality refers to balancing GHG emissions by reducing emissions as much as possible and offsetting remaining emissions through absorption measures. This includes actions such as adopting renewable energy and using carbon offsets to neutralize residual emissions.
The carbon budget, by contrast, refers to the total cumulative amount of CO₂ that can be emitted while keeping global warming within a specific temperature threshold. Because past emissions are already fixed, meeting climate targets depends entirely on how much future emissions can be reduced (*14).
The IPCC report also mentions the carbon budget required to limit temperature rise to within the 1.5°C and 2°C ranges. Since 1750, humanity has emitted approximately 2.56 trillion tons of CO2. To limit the temperature rise to 1.5°C, only 40 billion tons remain in the budget. (See Figures 3)
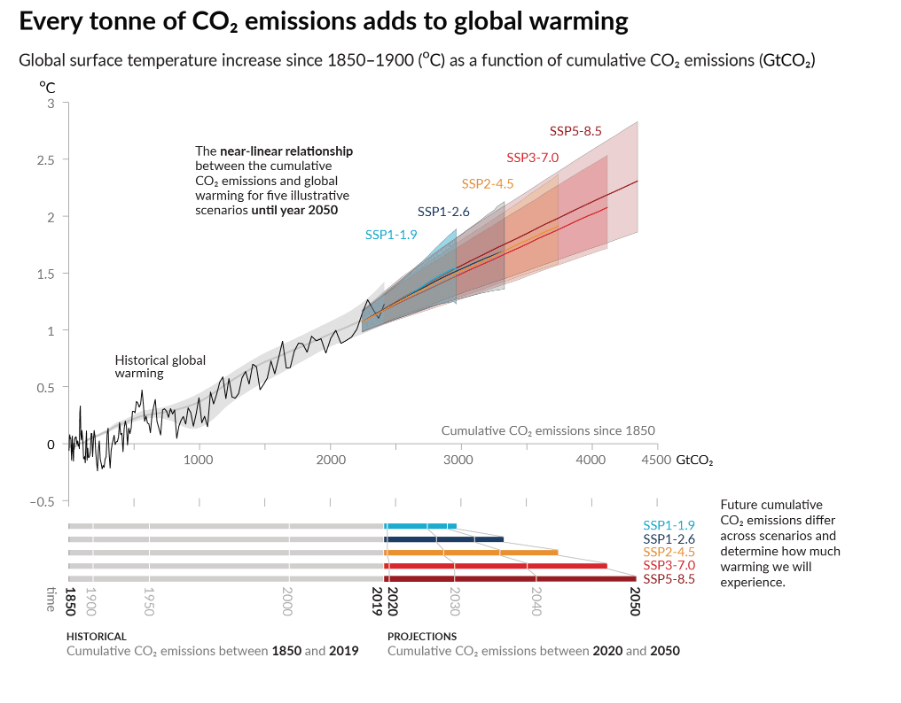
Figure3 <Reference>IPCC Sixth Assessment Report Working Group 1 Summary for Policymakers Figure SPM.10(*15)
If emissions follow a very low trajectory consistent with SSP1-1.9, global temperatures may reach 1.5°C between 2021 and 2040, slightly exceed it between 2041 and 2060 at around 1.6°C, and then stabilize near 1.4°C over the long term.
However, to achieve the Paris Agreement’s goal of limiting global warming to 1.5°C, we must pursue even higher targets. Therefore, carbon-negative initiatives are crucial, not just carbon neutrality.
IV. Why Carbon Negative Should Be Pursued
What Is Carbon Negative?
Alongside the Paris Agreement and initiatives such as the 2050 Carbon Neutrality Declarations announced in 2020, attention has increasingly turned to carbon negative strategies.
Carbon negative refers to a state in which the amount of CO₂ removed from the atmosphere exceeds the amount emitted (*16). Unlike carbon neutrality, which offsets emissions primarily through financial mechanisms, carbon negative represents a more proactive approach to decarbonization by reducing cumulative emissions to below zero (*16) (see Figure 4).
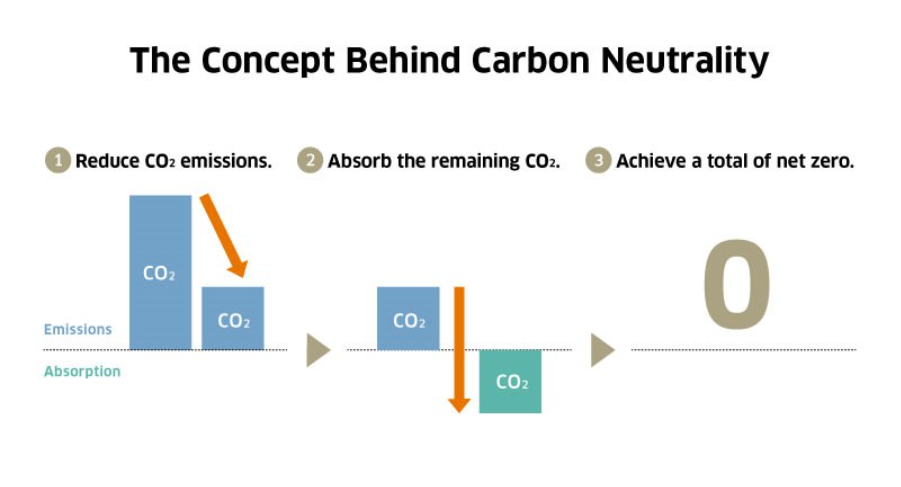
Figure4 <Reference> The Concept of Carbon Neutrality. © Kawasaki Heavy Industries, Ltd.
Common carbon-negative approaches include afforestation and the expansion of green energy production.
Microsoft is widely recognized as a leading company committed to carbon negative initiatives. In 2020, Microsoft announced a pledge to become carbon negative, water positive
, and zero waste by 2030, while also protecting ecosystems.
As a result of advancing its carbon negative initiatives, Microsoft reduced its Scope 1 and Scope 2 emissions by 29.9 percent in fiscal year 2024 compared with the fiscal year 2020 baseline. Scope 3 emissions increased by 26 percent from the fiscal year 2020 baseline to fiscal year 2024. At the same time, Microsoft has implemented a strategy to reduce Scope 3 emissions by 2030.
Microsoft has introduced concrete initiatives to address the following challenges (*17)
①Accountability for its own carbon footprint
- Microsoft requires selected large suppliers to transition to 100 percent carbon free electricity for the products and services they provide.
- By 2030, Microsoft aims to use sustainable aviation fuel, where feasible, for business related air travel.
- To reduce emissions from data centers and operational inputs such as construction materials, chips, and fuel, Microsoft focuses on developing and supporting innovative solutions that prioritize long term structural change rather than short term stopgap measures.
- Microsoft has set a goal to always match 100 percent of its electricity consumption with zero carbon energy purchases by 2030. To achieve this, the company has signed and operates large scale renewable energy and nuclear power purchase agreements across multiple regions[*18]
②Global collaboration, investment, and innovation beyond Microsoft’s own operations
- In 2020, Microsoft established the one-billion-dollar Climate Innovation Fund, which has since made significant investments in technologies such as commercial scale direct air capture and sustainable aviation fuel.
- Through AI powered platforms, Microsoft supports customers and organizations in centralizing and analyzing data and translating insights into action.
- In collaboration with the United Nations, Microsoft is accelerating AI driven solutions and advancing climate resilience initiatives.
Together with industry partners, Microsoft established the Symbiosis Coalition, which aims to generate up to 20 million metric tons of high quality, nature-based carbon removal credits by 2030.
The Importance of GHG Emissions Reduction in the Food System
Global GHG Emissions and the Importance of Action
GHG emissions associated with food production and consumption represent a major global environmental challenge.
According to the Food and Agriculture Organization (FAO), food systems accounted for 31% of total global GHG emissions in 2019. Agricultural production alone contributed more than 40% of food-system emissions, equivalent to 13% of total global emissions. Methane and nitrous oxide, which have particularly high global warming potential, largely originate from crops and livestock. Reducing the environmental footprint of agricultural production is therefore a critical issue (*19).
If food production is expanded using conventional methods to meet growing global demand driven by population growth and rising living standards in developing and emerging economies, GHG emissions in 2050 are projected to be 1.5 times higher than in 2012. This underscores the need for more efficient production methods that reduce emissions (*20).
To reduce GHG emissions across the food supply chain, it is essential to first accurately assess the environmental impact of agricultural production, which accounts for the largest share of emissions, and implement countermeasures without delay (*19).
Environmental Impact Assessment of Food and the Digital Product Passport (DPP)
The environmental impact of food is influenced not only by production and processing, but also by distribution, retail, consumption, and disposal. Life Cycle Assessment (LCA) is widely used as a methodology to evaluate environmental impacts across a product’s entire lifecycle, from raw material procurement and manufacturing to distribution, sales, and disposal.
For a detailed explanation of LCA, please refer to our related article (*21).
While LCA adoption has gradually expanded among companies in Japan, Europe has drawn particular attention for its legislative efforts to promote LCA through the Digital Product Passport (DPP) (*22).
A Digital Product Passport refers to an electronic “passport” required for the transportation and sale of products. It includes sustainability-related information such as manufacturer details, materials used, recyclability, and disassembly methods. The DPP is designed to ensure traceability aligned with a product’s LCA.
By digitally managing this information through the DPP, the EU may deny market access or impose high tariffs on products that fail to meet environmental standards. Recycling and reuse markets may also fall within the scope of these regulations (*23).
Accelerating Corporate ESG Activities Through the Visualization of Food Sustainability
Globally, the environmental impact of a product across its entire lifecycle has become a key criterion for evaluating sustainability, extending beyond the production phase alone. The ability to flexibly quantify and disclose environmental impacts helps companies address the interests of a wide range of stakeholders, including investors and consumers, while enhancing brand value. However, implementing LCA often involves challenges such as high costs, long lead times, and complex data collection processes.
“cuoncrop” provides “My-Eco-Ruler”, a system that aggregates and standardizes supply chain patterns specific to food and agriculture products, enabling highly efficient LCA implementation.
By conducting LCA at the product level, companies can quantitatively measure and visualize GHG emissions as well as other environmental indicators, including marine pollution and biodiversity impacts. This represents a critical element for companies in explaining and demonstrating their own sustainability initiatives to shareholders, business partners, and employees.
In addition to companies that have already implemented LCA, smaller enterprises, organizations outside the food and agriculture sector, and even corporate cafeterias can utilize this service to analyze environmental impacts related to food consumption. “My-Eco-Ruler”can be utilized not only by companies that have already implemented LCA, but also by relatively small enterprises that recognize the need for environmental impact analysis, as well as in food consumption settings—such as corporate cafeterias—within companies outside the food and agriculture sector.
Companies interested in visualizing environmental impacts are invited to contact “cuoncrop” for further discussion.
cuoncrop ESG Global Trend Research Division
References
(*2)https://www.nhk.or.jp/minplus/0019/topic037.html
(*3) https://www.enecho.meti.go.jp/about/special/johoteikyo/ipcc.html
(*4)https://www.nhk.or.jp/minplus/0019/topic037.html
(*5)https://www.jccca.org/global-warming/knowleadge01
(*6)https://www.jccca.org/dictionary/10352
(*7)https://www.data.jma.go.jp/cpdinfo/ipcc/ar6/IPCC_AR6_WGI_SPM_JP.pdf
(*8)https://gurilabo.igrid.co.jp/article/3533/
(*9)https://www.data.jma.go.jp/cpdinfo/ipcc/ar6/IPCC_AR6_WGI_SPM_JP.pdf
(*10) https://www.data.jma.go.jp/cpdinfo/ipcc/ar6/IPCC_AR6_WGI_SPM_JP.pdf
(*11) https://www.data.jma.go.jp/cpdinfo/ipcc/ar6/IPCC_AR6_WGI_SPM_JP.pdf
(*12) https://gurilabo.igrid.co.jp/article/3533/
(*14)https://zeroc.co.jp/column/ipcc_ar6/#1-1
(*15)https://www.jccca.org/download/43037
(*16)https://www.meti.go.jp/press/2021/08/20210809001/20210809001-2.pdf
(*17) https://www.meti.go.jp/press/2021/08/20210809001/20210809001-2.pdf
(*18)https://gurilabo.igrid.co.jp/article/3533/
(*19)https://www.unic.or.jp/news_press/info/44283/
(*20)https://www.greenpeace.org/japan/campaigns/story/2022/07/26/58496/
(*21) https://ondankataisaku.env.go.jp/carbon_neutral/about/
(*22) https://earthene.com/media/1293
(*23) https://www.jccca.org/download/42990
(*24) https://www.jccca.org/download/42990
(*25) https://wajo-holdings.jp/media/6343#outline__1
(*26) https://ondankataisaku.env.go.jp/carbon_neutral/about/
(*27) https://business.nikkei.com/atcl/gen/19/00081/050600368/
(*28) https://news.microsoft.com/ja-jp/2020/01/21/200121-microsoft-will-be-carbon-negative-by-2030
(*29) https://www.fao.org/3/cb7514en/cb7514en.pdf
(*30) https://www.mri.co.jp/knowledge/mreview/2022124.html
(*31) https://www.mri.co.jp/knowledge/mreview/2022124.html
(*32)https://www.mri.co.jp/knowledge/mreview/2022124.html
(*33) https://www.mri.co.jp/knowledge/mreview/2022124.html
(*34)https://cuoncrop.com/en/wpcore/2022/07/22/food-sustainability-lifecycle/
(*35)https://hadea.ec.europa.eu/calls-proposals/digital-product-passport_en